Summer Campaign 2015
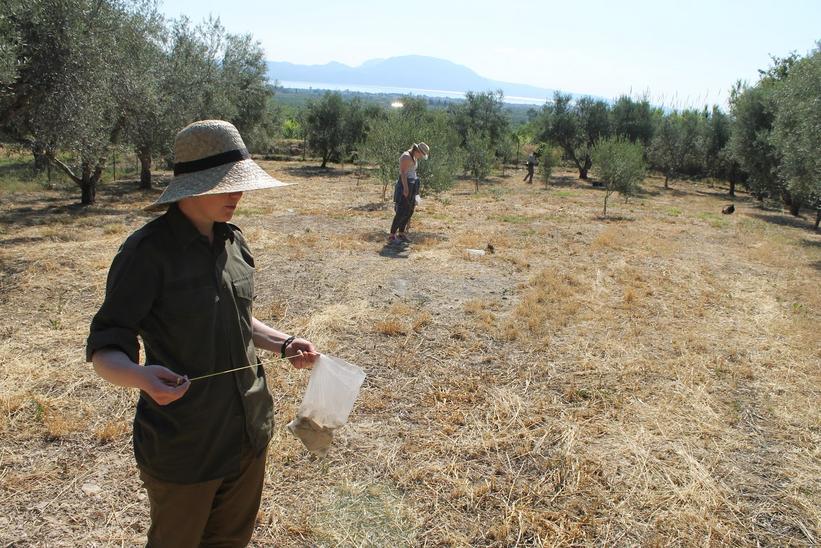
During the 2015 campaign, a side-by-side survey (K. Winther-Jacobsen, G. Giannakopoulos), remote sensing through aerial photography (R. Frederiksen) and geophysical investigations (W. Rabbel, H. Stümpel and B. Ullrich) were carried out. In the side-by-side survey, 578 units were surveyed covering an area of 0.79 square km (Fig. 1). A total number of 52.326 pottery fragments, 17 lithics as well as 85 architectural artefacts were collected, washed, counted and described, while the most important specimens were drawn and photographed (Fig. 2). A pottery inventory was created consisting of 328 sherds, however, a detailed study of the chronology awaits the 2016 season. According to our preliminary observations, the surface revealed far richer traces of the buried past than we had dared to hope for, based on our knowledge of the geomorphology of the landscape of Sikyon. The finds date from the Late Neolithic-Early Bronze Age to the present day, but material from the Classical period is predominant.
.")
The preliminary overview of the distribution of finds recorded by the intensive survey (Fig. 3) appears to confirm existing theories on the location of the pre-Hellenistic city. Elevated densities are recorded predominantly on the second and third marine terraces (the ones closest to the plateau) directly north of the river Asopos. This is also the area where emergency excavations have revealed architectural remains of habitation. Additionally, graves seem to line up along the edge of the second marine terrace which actually cuts directly through the area with elevated densities. It needs to be clarified if the densities beyond these graves indicate a later extension of the city.
.")
The geophysical investigations carried out in 2015 comprised geomagnetic (Fig. 4), electrical resistivity (Figs. 5-6), seismic (Figs. 5-6) and georadar surveys (Fig. 7). These revealed a series of interesting structures (Fig. 8). In general, indications for the densest occupation are found in the area immediately to the east of the southernmost spur of the plateau. Here, several continuous linear structures may be interpreted as streets that form a roughly rectangular pattern. Two parallel linear anomalies in the resistivity profiles seem to point to a large building in this area. Further to the north, on the eastern side of the National Road, two magnetic maxima may be interpreted as a crossroads, and south and south-west of this area, more anomalies point to a street grid in approximately the same orientation. A broad double magnetic maximum of more than 150 m length in the eastern part of this area is running a bit off this orientation from north-west to south-east and is merging into a single one in its further progress. Perhaps it can be connected to a wall. To the south-east of this area, north of the river Asopos and west of the new train track to Kiato, two parallel linear anomalies – a magnetic minimum right next to a maximum – could point to a ditch or a wall, or both next to each other. On the edge of the second marine terrace close to the new train track, a trapezoidal structure might be connected to an ancient quarry.
The general picture points to a city centre close to the south-eastern spur of the plateau, and extensions or suburbs and further peripheral structures in the extended area of the second marine terrace. The different candidates for larger walls might reflect parts of the town’s defences in its different phases.
.")
.")
.")
.")
.")